An empirical method (bootstrap) to differentiate between features that constitute signal versus noise based on the magnitude of their persistence relative to one another. Note: you must have at least 5 features of a given dimension to use this function.
id_significant(features, dim = 1, reps = 100, cutoff = 0.975)
Arguments
| features | 3xn data frame of features; the first column must be dimension, the second birth, and the third death |
|---|---|
| dim | dimension of features of interest |
| reps | number of replicates |
| cutoff | percentile cutoff past which features are considered significant |
Examples
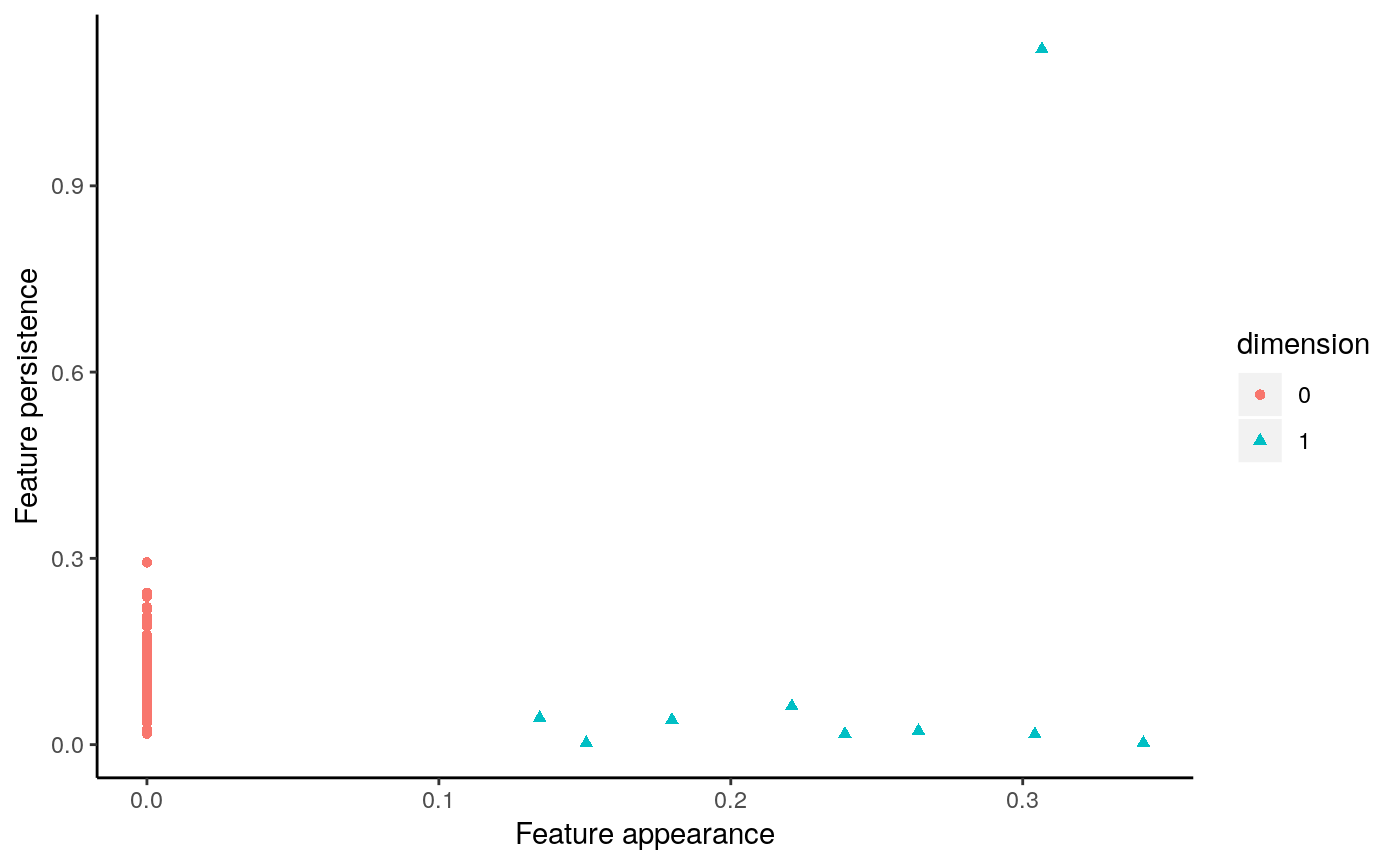
# get dataset (noisy circle) and calculate persistent homology
angles <- runif(100, 0, 2 * pi)
x <- cos(angles) + rnorm(100, mean = 0, sd = 0.1)
y <- sin(angles) + rnorm(100, mean = 0, sd = 0.1)
annulus <- cbind(x, y)
phom <- calculate_homology(annulus)

# find threshold of significance
# expecting 1 significant feature of dimension 1 (Betti-1 = 1 for annulus)
thresh <- id_significant(features = as.data.frame(phom),
                         dim = 1,
                         reps = 500,
                         cutoff = 0.975)

# generate flat persistence diagram
# every feature higher than `thresh` is significant
plot_persist(phom, flat = TRUE)