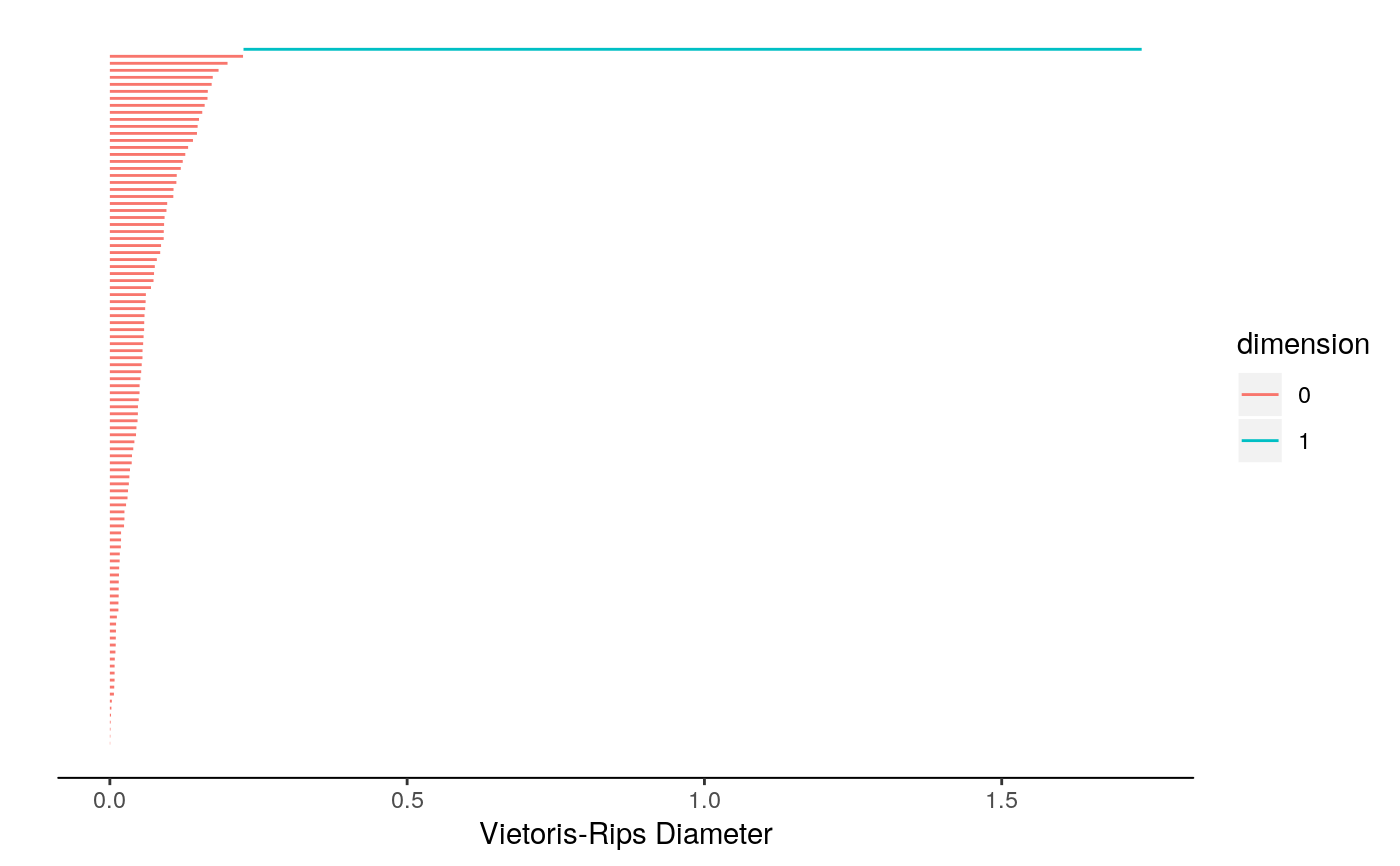
Plots a feature matrix as a topological barcode. See `plot_persist` for an alternate visualization method of persistent homology.
plot_barcode(feature.matrix)
Arguments
| feature.matrix | nx3 matrix representing persistent homology features |
|---|
Value
ggplot instance representing topological barcode
Details
The `feature.matrix` parameter should be a numeric matrix with each row corresponding to a single feature. It should have 3 columns corresponding to feature dimension (col 1), feature birth (col 2), and feature death (col 3). The first column should be filled with integers, and the next two columns should be filled with numeric values. The output from the `calculate_homology` function in this package will be a valid value for the `feature.matrix` parameter.
This function uses the ggplot2 framework to generate persistence diagrams. For details, see: Wickham H (2009). ggplot2: Elegant Graphics for Data Analysis. Springer-Verlag: New York, NY.
Examples
# create a 2-d point cloud of a circle (100 points)
num.pts <- 100
rand.angle <- runif(num.pts, 0, 2*pi)
pt.cloud <- cbind(cos(rand.angle), sin(rand.angle))

# calculate persistent homology (num.pts by 3 numeric matrix)
pers.hom <- calculate_homology(pt.cloud)

# plot calculated homology features as persistence diagram
plot_barcode(pers.hom)